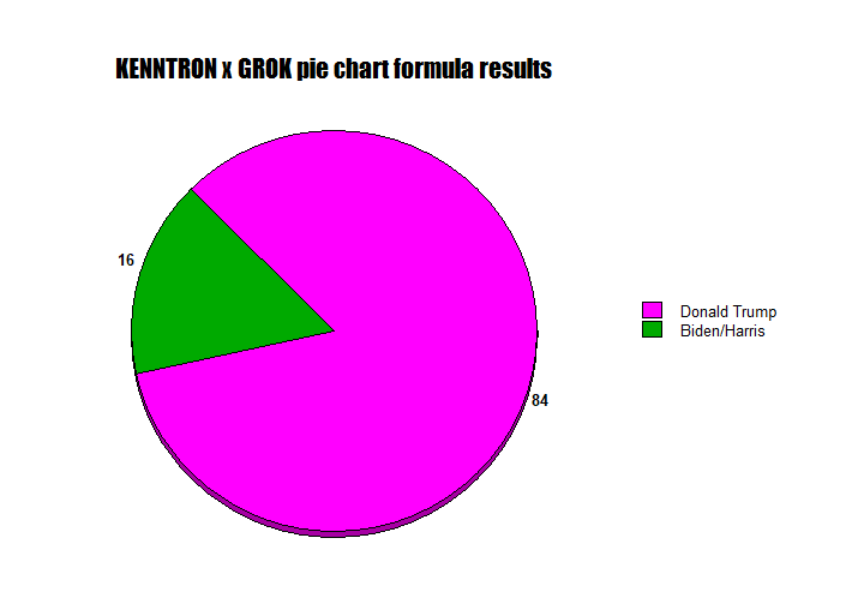
KENNTRON x GROK pie chart formula prediction
WINNER: Donald Trump
90,000,000 ballots
451 electoral votes
RUNNER UP: Biden/Harris
17,000,000 ballots
86 electoral votes
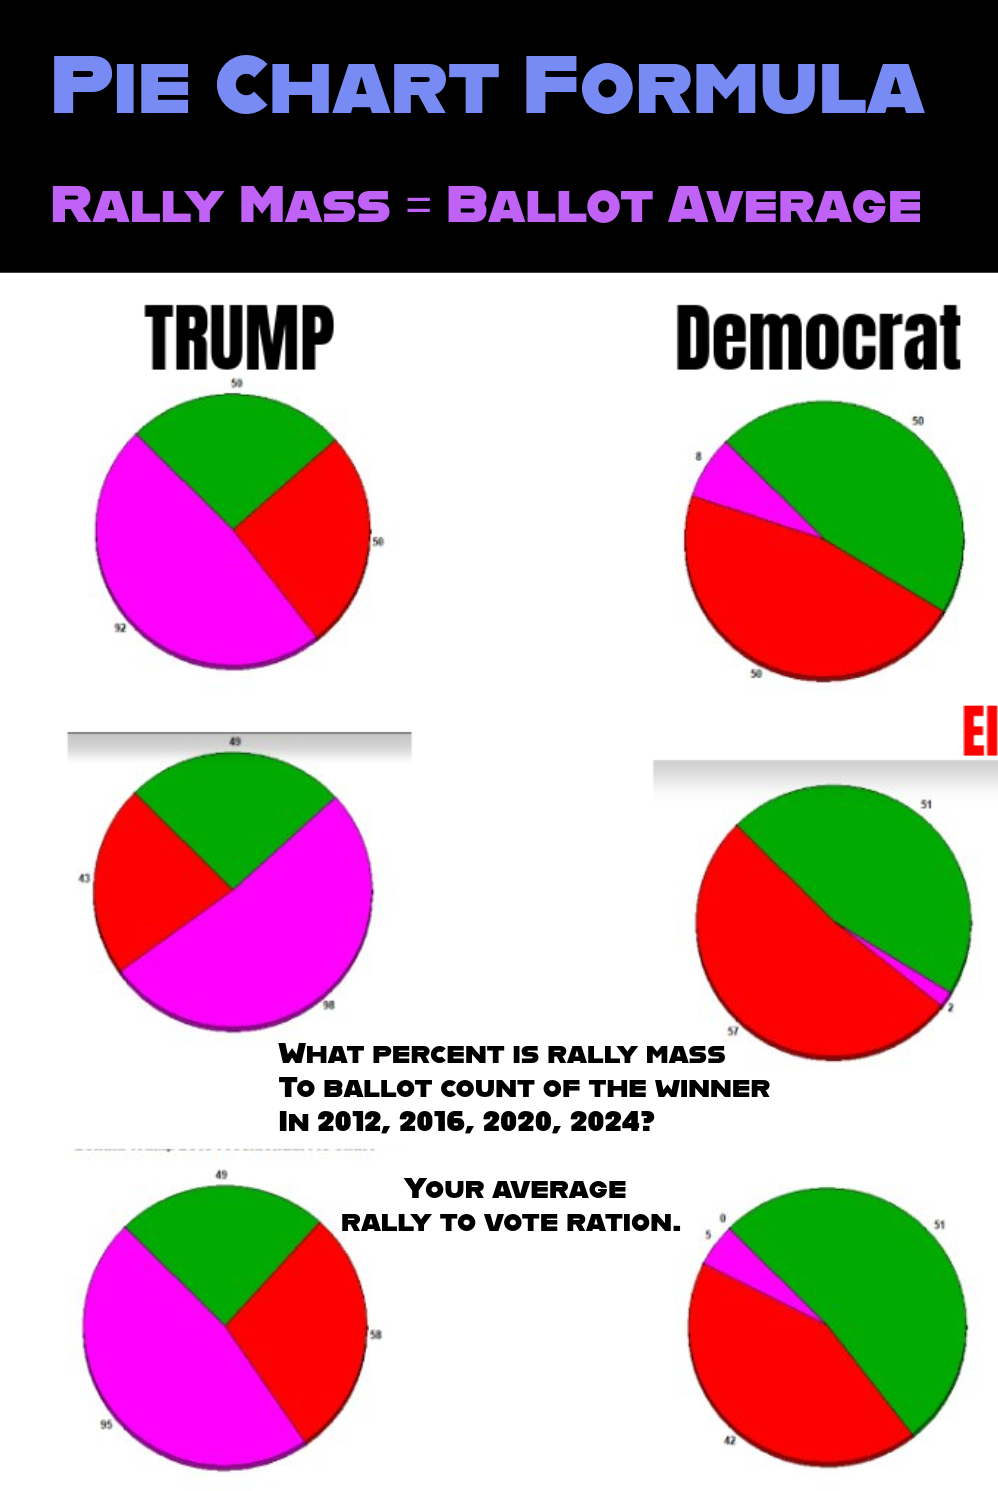
The average rally to vote ration (according to my basic math) for all 2016 and 2020 candidates is set at 1.1% RVR
Trumps average rally to vote ration (official count for trump is 3%)
Biden/Harris 25 rallies excluding November: 219,000 (sauce: News Media)
Trump 270 rallies excluding November: 664,000 (sauce: News Media x Kenntron x Grok)
Re-adjusting Donald Trump rally mass according to the average of supporters in October x the 900 rallies on record (for 2016, 2020, and 2024) divided by 3 (election cycles) subtract 10% for less rallying in this election cycle = 270 rallies
The average of Donald Trump rallies for October 2024 (the only month Kenntron counted more than 3 rallies for Trump):
Q: Grok with is the average number of 5000, 5000, 21000, 17000, 21000, 8000, 11000, 4000, 15000, 11000, 4000, 8000, 10000, 7000, 11000, 1000, 12000, 5000, 11000, 6000, 5000, 20000, 8000, 9000, 8000, 8000, 8000?
A: 10,000
10,000 x 270 = 2,700,000
2.7m + 219k = 2,919,000
What percent is 2,700,000 of 2,826,000 = 92%
The official 2024 Presidential rally is 8/92%
What percent is 2,700,000 of 90,000,000 = 3%
What percent is 219,000 of 17,000,000+ = 1.2% (close enough)
90,000,000 + 17,000,000 = 107,000,000
What percent is 90,000,000 of 107,000,000 = 84%
What is 84% of 538 (electoral college votes) = 451


