
Presidential Pie Chart for my art project is calculable with the same mathematical principals that ancient astronomers used to predict planets because a rally crowd is a mass.
Mass (rally count) x % (planet average mass) = Planet (Ballot Tally)
- A rally is the richest voting block a candidate can have because they can be verified as seen in the news media listening to their candidate speak directly.
- The Electoral Collage can be shown as majorly faithless votes in my pie chart.
- Ballot machines are ancient technology prone to errors and hacking.
In Pie Chart Congress we observe and count these brave American civilians, that can be seen with world wondering eyes as self evident truth in the news media, showed up to support a candidate for President.
- My rally count going back to 2016 is presented at my blog and at The Voter Count Of Mars pages.
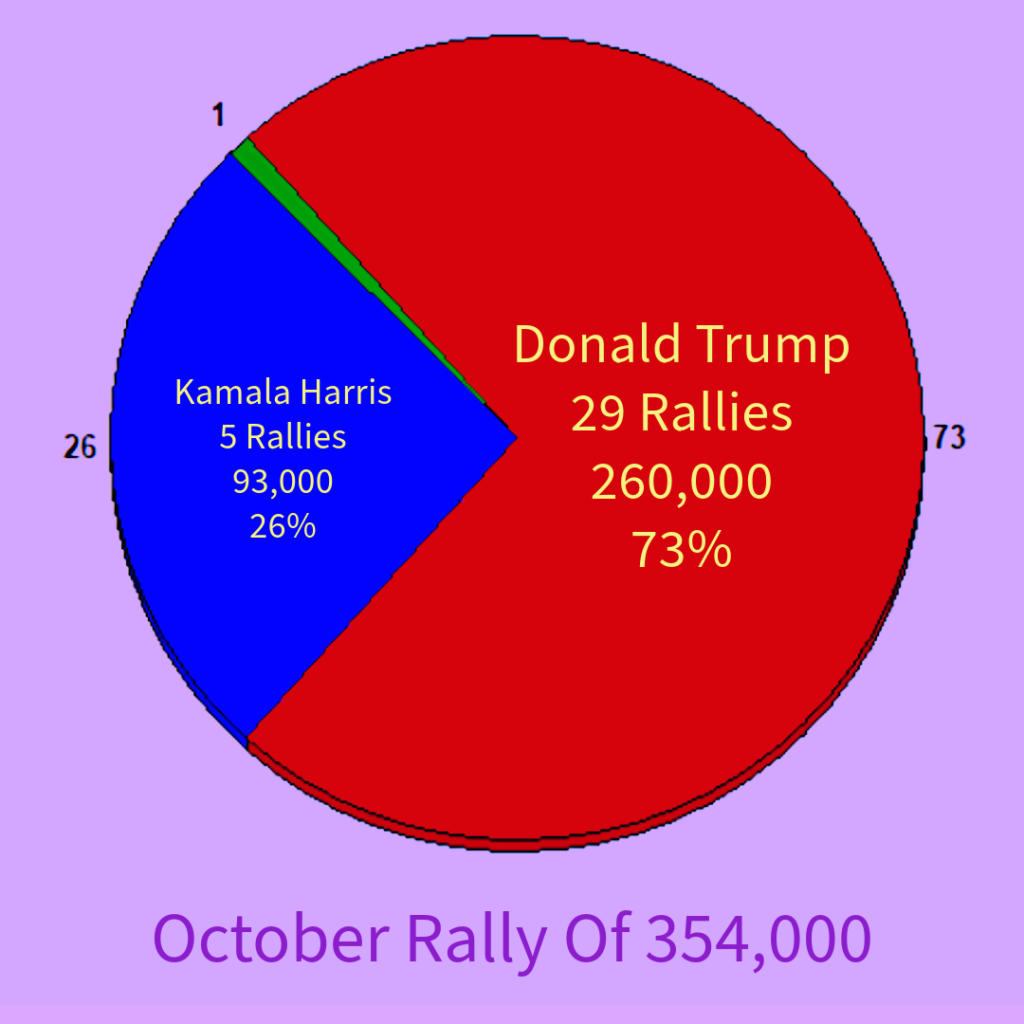
- These great people as seen in my September 2024 Pie Chart.
- My human effort to count the rallies and make a ballot prediction.
- An Official submission of my pie chart to political science.
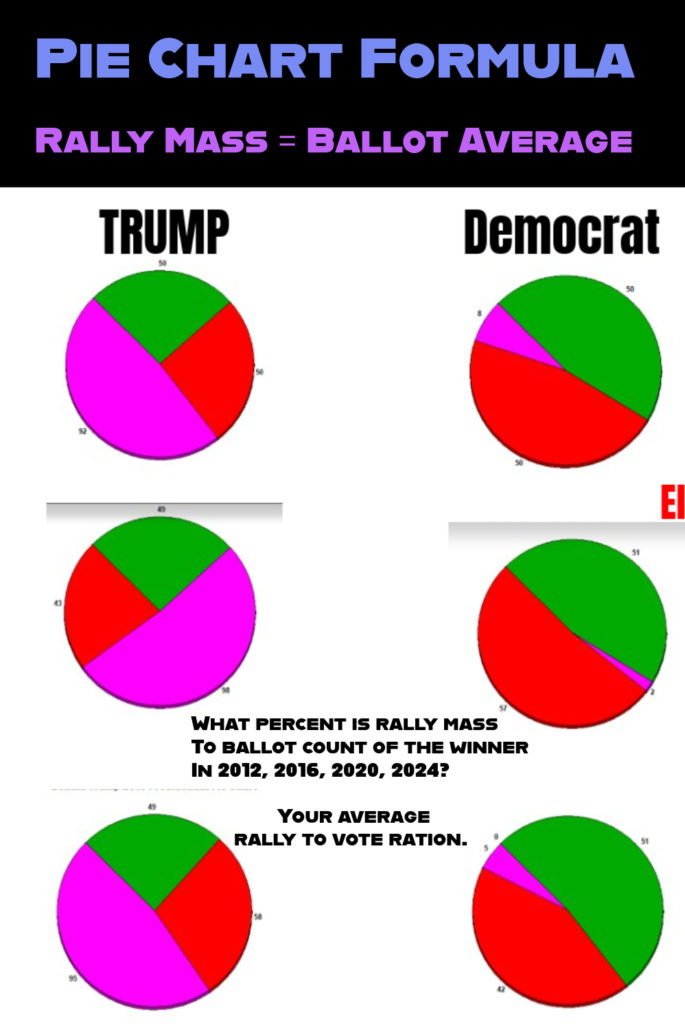
The concept of my pie chart is for election results that include the sum of all presidential rallies. This gives us a measure of rallying voters to votes as an average percentage we can describe as a rally to vote ratio (RVR). With my pie chart we can see how many voters are rallying for President, and zooming into my pie chart we can see literal pictures, videos, and news reports confirming the numbers. These numbers are, however, emotionless, facts of mathematics.
I am sharing for the wealth of information in the public database my rally count. I am doing my best to be unbiased as an independent poller for my art project. Forwarding, these numbers are in fact nails screeching a chalk board to the acoustic.
A grade school student could do this math.
To be elected President history shows no less than 100,000 people rallying to average the RVR for 50+ million ballot minimum to win Presidency.
- The closer to 100% RVR means that 100% of people casting a ballot also rallied, meaning if you are Donald Trump in 2020 with 100% RVR all 74 million voters can be counted at a rally.
- The closer to 0% RVR means that 0% of people casting a ballot also rallied, meaning if you are Donald Trump in 2020 with 0% RVR then none of your 74 million voters can be counted at a rally.
- The win or lose limit for a rally to vote average is set by previous Presidential elections at .2% RVR to win or lose Presidency,
- WIN 100% — WIN/LOSE LIMIT—0% LOSE
EPIC WIN 100% —W—W—W—W—W—W/L LIMIT .2% —L—L—0% AINT NO WAY
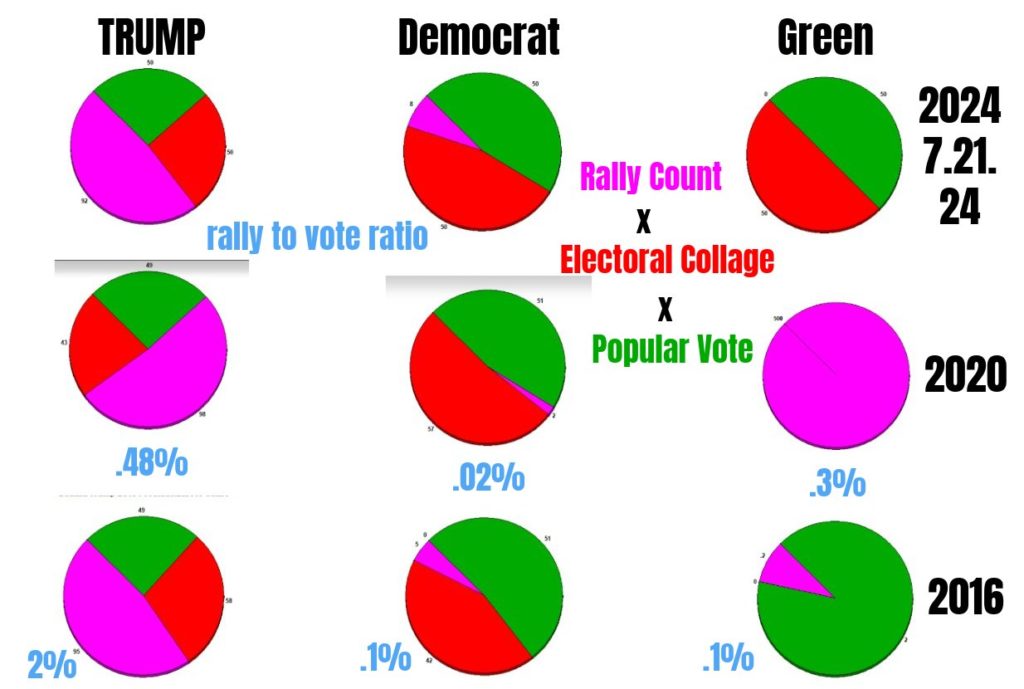
The numbers I’ve summed myself are derived from news media resources available to the general public and basic enough to be doubled checked by anybody that thinks a .02% for Joe Biden in 2020 is mathematically impossible.
I am not myself going to begin to explain how there is a .02% RVR in my pie chart because I am just making my art project.
What I have learned in making my art project is that Popular Votes have ballot stuffing machine hacks, and Electoral College does faithless voting, but the Rally crowds are indivisible, one nation, with liberty and justice for all.
On the ballot 80% of votes cast are without ever hearing a candidate speak, and a person that goes to a rally hears everything a President is saying. A person that has been to a rally is the richest form of voter a candidate could have. If you have a healthy rallying crowd then you can be President.
